One Piece Of Housekeeping Before The Analysis#
A note on what this article can and cannot tell you.
There is no SSC CGL 2026 cut-off yet. Tier 1 for the 2026 cycle runs from 30 September to 30 October 2026. At the time of writing the examination has not begun. No shift-wise difficulty data exists, no response sheets exist, and any figure presented as the 2026 cut-off is a projection rather than a result.
What does exist is a clear multi-year trend, and that trend is genuinely informative. Cut-offs across categories have climbed steadily, and the forces driving that climb are identifiable and likely to continue.
So this is a trend analysis with a projection attached, clearly labelled as such. That is more useful than a confident number, and considerably more honest.
Background: What A Cut-Off Actually Is#
Three definitions, because the confusion here causes real strategic errors.
A cut-off is an output, not a threshold. Nobody sets it in advance. The Commission ranks candidates and draws a line where the required number is reached. The cut-off is simply the score of the last candidate above that line. It is determined by how everybody performed, not by a standard set beforehand.
Category-wise cut-offs are separate lines on the same list. General, OBC, SC, ST and EWS candidates are ranked and cut within their own pools against seats reserved for those pools. This is why the numbers differ, and why comparing a General cut-off to an OBC one tells you nothing about relative difficulty.
Normalised scores, not raw marks. Because SSC CGL Tier 1 runs across many shifts with different question papers, raw scores are statistically adjusted for shift difficulty. The published cut-off is expressed in normalised terms, which is why it appears with decimal places rather than as a whole number.
The Trend, Category By Category#
Here is the movement across recent cycles for SSC CGL Tier 1.
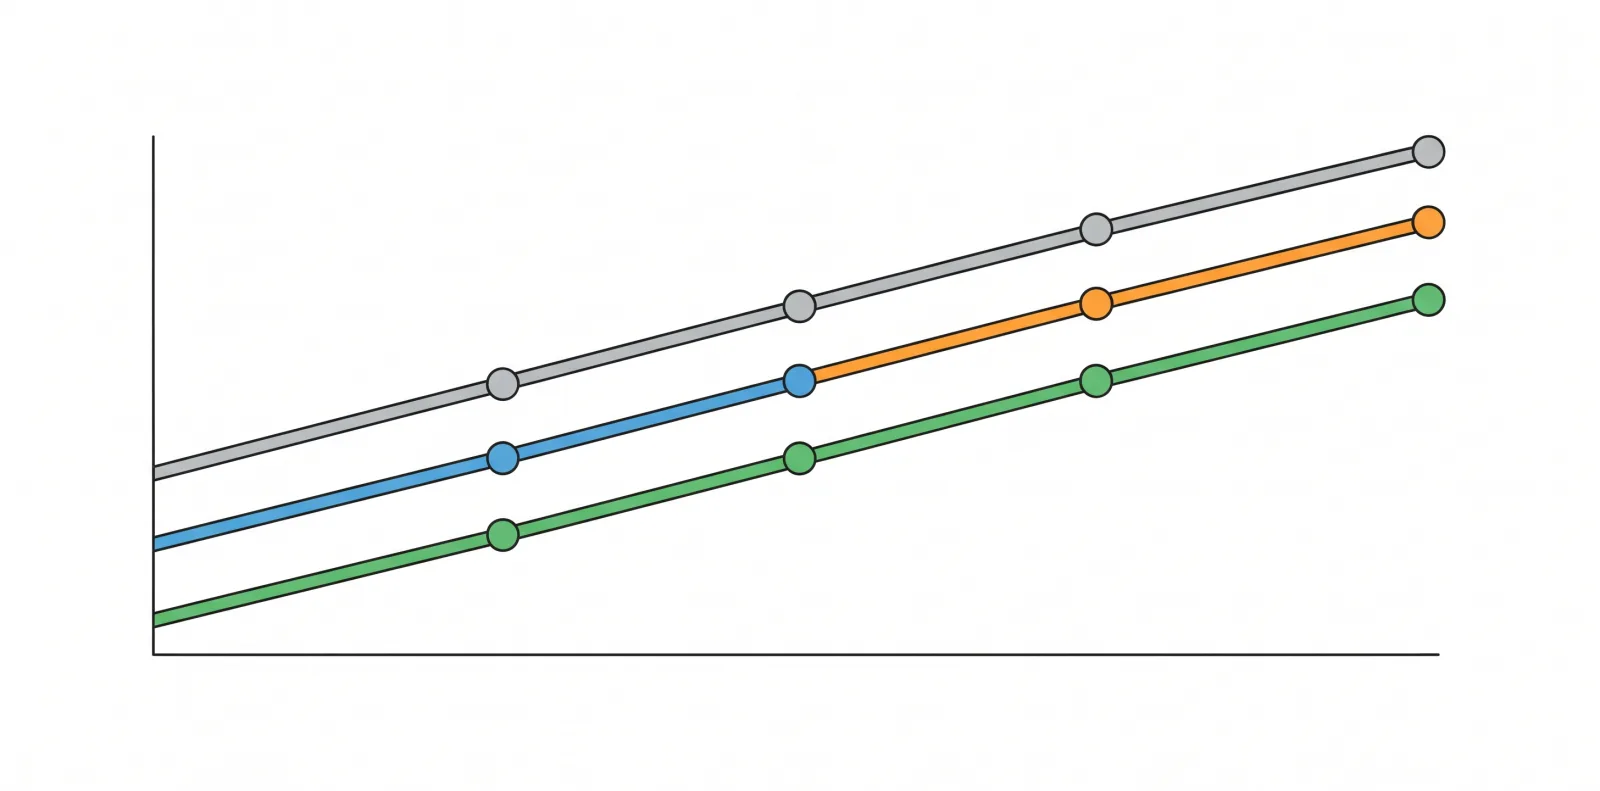
General category. Rose from 160.04 in 2022 to 175.44 in 2024, an increase of more than fifteen marks across three cycles.
OBC category. Rose from 140.68 to 153.70 across the same period, a comparable climb of around thirteen marks.
SC category. Rose from 130.31 to 141.63.
ST category. Rose from 117.51 to 126.28, the gentlest climb of the four but still clearly upward.
The pattern is consistent across categories, which is itself informative. If only one category's cut-off were rising, you would look for a category-specific explanation. A uniform climb points to causes affecting the whole candidate population.
What Is Actually Driving The Climb#
Four forces, in rough order of contribution.
One: preparation quality has risen sharply, and it is now free. This is the largest factor and it is easy to underestimate. A decade ago, serious preparation material meant buying books and, for many, relocating to a coaching hub. Today a candidate anywhere with a mobile connection has access to free video lectures, free previous year papers, free mock tests and structured online communities. The floor has risen enormously. When the median candidate prepares better, the score at any given rank rises, and the cut-off with it.
Two: the applicant pool keeps growing. Graduate numbers have risen steadily and the attractiveness of secure government employment has not diminished. More candidates competing for a broadly similar number of posts pushes the line up mechanically.
Three: the shift to fully computer-based testing changed attempt behaviour. Candidates now practise on the exact interface they will face, with thousands of mock tests available in the same format. Familiarity with the format converts directly into attempts, and attempts convert into marks.
Four: vacancy counts have not kept pace with applicant growth. Twelve thousand two hundred and fifty-six posts in the 2026 cycle is a substantial recruitment by any measure. It is not growing at the rate the applicant pool is.
And a correction worth making. A rising cut-off is frequently read as evidence that the examination is getting harder. It usually indicates the opposite, or at least something different: that candidates are scoring better. A genuinely harder paper depresses scores across the population and pulls the cut-off down. When you see a cut-off jump, the first hypothesis should be an easier paper or a better-prepared cohort, not a more difficult examination.
What This Should Change About Your Target#
Set your target above the trend line, not at it. If the General cut-off reached 175 in 2024 and has been climbing at around five marks a cycle, planning for 175 is planning to miss. A target in the region of 185 to 190 out of 200 gives you margin for a difficult shift, a normalisation adjustment that goes against you, and the ordinary variance of an examination day.
Understand that your cut-off is post-specific as well as category-specific. The published cut-offs vary by post preference, and the posts most candidates want carry the highest lines. A score clearing the overall category cut-off may not clear the line for the post you actually want.
Accuracy matters more in a high-cut-off environment. When the line sits at 175 out of 200, you can afford very few errors. With two marks for a correct answer and half a mark deducted for a wrong one, four careless mistakes cost you ten marks, which at these levels is thousands of ranks. Error analysis is now worth more than additional content coverage for most candidates near the line.
And remember that Tier 1 is qualifying. For SSC CGL, clearing Tier 1 comfortably is the objective; the marks do not carry into your final merit. A candidate obsessing over a Tier 1 margin is optimising the wrong stage. Tier 2 is where selection happens.
Reading Any Cut-Off Claim Critically#
A short checklist for the numbers you will see circulating.
Which year, and has that examination actually been held? Projections presented as results are common. If the examination has not taken place, no cut-off exists.
Which category, and which post? A single number without both is meaningless.
Tier 1 or Tier 2? These are different examinations with different scales and different implications.
Normalised or raw? SSC publishes normalised figures. A raw-mark claim is not comparable.
What is the source? The Commission publishes its cut-off documents officially. Anything else is a reconstruction, however confident.
And is the trend being extrapolated sensibly? A three-year climb does not guarantee a fourth. A genuinely difficult paper, a change in vacancy count or a pattern revision can break the pattern in either direction.
How Normalisation Interacts With The Cut-Off#
Because SSC CGL Tier 1 runs across many shifts, the published cut-off is a normalised figure, and understanding what that means prevents a common misreading.
Normalisation adjusts for shift difficulty. Candidates who sat a harder paper have their scores adjusted upwards relative to those who sat an easier one, so that the shift you were allotted does not determine your outcome. The Commission publishes its methodology.
Your normalised score can differ noticeably from your raw marks. A candidate who counts 168 from the answer key may see a normalised figure above or below that, depending on how their shift performed overall.
This is why post-examination score predictions are unreliable. Answer key calculations give you a raw mark. The cut-off is expressed in normalised terms. Comparing the two directly is not a valid comparison, and a great deal of results-week anxiety comes from doing exactly that.
It also means a hard shift is not a disaster. If your paper was difficult, it was difficult for everyone in that shift, and the adjustment accounts for it. Candidates who write off an attempt on the basis of how the paper felt are frequently wrong.
What it does not do is equalise individual experience. Normalisation corrects at the shift level. If your particular strength happened to be underrepresented in your shift's paper, the adjustment does not capture that.
The practical instruction. Do not attempt to predict your normalised score from your raw marks. Wait for the Commission's published result, and in the meantime continue preparing for the next stage rather than recalculating.
Applying This Reasoning To Other Recruitments#
The forces pushing SSC cut-offs upward are not specific to SSC, and the same reading applies across the landscape.
Banking recruitments show the same pattern. Free online material, abundant mock tests and format familiarity have raised the median candidate's performance in exactly the same way. Prelims cut-offs have moved upward across recent cycles for comparable reasons.
Railway recruitments add a further factor. Very large applicant volumes against vacancy counts that fluctuate with recruitment cycles produce sharper year-to-year movement than SSC's, so trend extrapolation is less reliable there.
State commissions vary enormously, because applicant pools are state-bounded and vacancy counts swing considerably between cycles. A trend over three cycles in one state tells you little about the fourth if the vacancy count halves.
UPSC behaves differently again, because the Prelims cut-off is driven by a fixed ratio of candidates advanced to Mains rather than by a vacancy count directly. That makes it more sensitive to paper difficulty and less sensitive to vacancy fluctuation.
The general rule that holds everywhere. Where preparation resources have become free and abundant, median performance rises and cut-offs follow. Where vacancy counts fluctuate sharply, trends break. Read any cut-off trend by asking which of those two forces dominates in that particular recruitment.
And the practical instruction is the same throughout. Set your target above the recent trend line rather than at it, and treat accuracy as the lever that matters most once you are near the line.
Frequently Asked Questions#
What is the SSC CGL 2026 cut-off?#
It does not exist yet. Tier 1 for the 2026 cycle runs from 30 September to 30 October 2026, and cut-offs are published only after the examination and evaluation. Any figure circulating now is a projection.
How much have cut-offs risen recently?#
For SSC CGL Tier 1, the General category rose from 160.04 in 2022 to 175.44 in 2024, and OBC from 140.68 to 153.70. SC and ST categories climbed by comparable margins. The trend is consistent across categories.
Does a rising cut-off mean the exam is getting harder?#
Usually the opposite. A harder paper depresses scores across the population and pulls the cut-off down. A rising cut-off generally indicates an easier paper or a better-prepared candidate pool, most likely the latter given the trend's consistency.
Why are General and OBC cut-offs different?#
Because candidates are ranked and cut within their own category pools against the seats reserved for those pools. The two numbers describe separate competitions and comparing them says nothing about relative difficulty.
What target score should I set?#
Above the trend line rather than at it. If the General cut-off reached around 175 and has climbed roughly five marks a cycle, a target in the 185 to 190 range out of 200 provides margin for shift difficulty, normalisation and examination-day variance.
What is driving the increase?#
Mainly the collapse in the cost of good preparation material, which has raised the median candidate's standard sharply. Alongside that, a growing applicant pool, greater familiarity with computer-based formats, and vacancy counts that have not grown at the same rate.
Do cut-offs differ by post?#
Yes. Published cut-offs vary by post preference as well as by category, and the most sought-after posts carry the highest lines. Clearing the category cut-off does not guarantee the post you wanted.
Where should I check official cut-offs?#
On ssc.gov.in, which publishes category-wise and post-wise cut-off documents after each stage. Use the Commission's own document rather than reconstructions, which frequently conflate tiers, categories and years.